
From Data to Decisions: Where Excel and BI Reach Their Limits
Excel Shows. BI Explains. But Who Helps You Decide?
CFO INSIGHTS
5/19/20263 min read
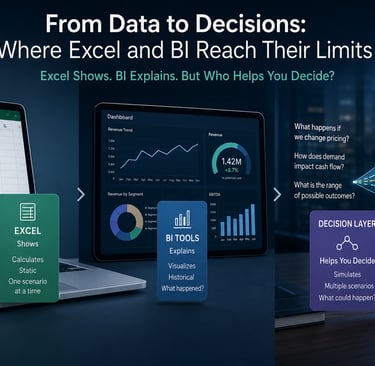
From Data to Decisions: Where Excel and BI Reach Their Limits
Excel Shows. BI Explains. But Who Helps You Decide?
For most businesses, working with financial data follows a familiar path. Data is collected. It is organized, analyzed, and eventually presented in reports or dashboards. Over time, this process has been shaped by two dominant tools — spreadsheets and business intelligence platforms.
Each plays an important role. Each solves a specific problem.
And yet, when it comes to making decisions, something is often missing.
Where everything begins: Excel
Spreadsheets have long been the backbone of financial work. They are flexible, powerful, and capable of handling complex calculations. From budgeting to forecasting, Excel allows finance teams to build models tailored to their needs. It is often the place where assumptions are tested and scenarios are built.
But this flexibility comes with a trade-off.
Most models are static. They depend on predefined inputs and typically explore one scenario at a time. While it is possible to build more advanced models, they quickly become complex, difficult to maintain, and hard to interpret.
As a result, the focus often remains on calculating results — not on fully understanding how those results might change.
The next step: BI tools
As businesses grow, the need for better visibility leads to the adoption of BI tools.
Dashboards replace spreadsheets. Data becomes more structured. Information is easier to access and share across the organization.
BI tools are excellent at showing what has happened. They help track performance, identify trends, and bring clarity to historical data. They make information more accessible and easier to interpret.
But they are still focused on the past.
Even when real-time data is available, the question being answered is usually the same:
What is happening and what does it mean for the business?
Where the gap appears
At first glance, this combination seems sufficient.
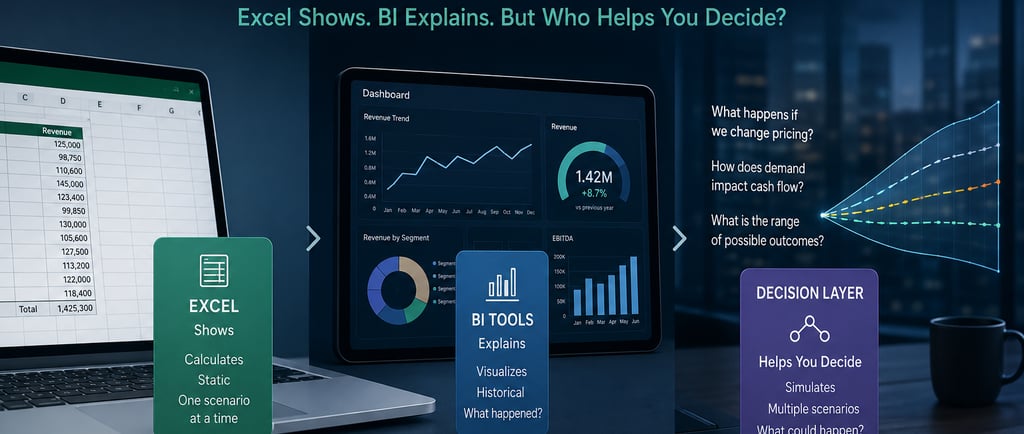
Spreadsheets calculate. BI tools visualize.
But when decisions need to be made, a different set of questions emerges:
What happens if we change pricing?
How will growth affect cash flow over the next months?
What if costs increase at the same time as demand shifts?
How sensitive is the business to small changes?
These are not reporting questions. They are decision questions.
And this is where the gap becomes visible. Because neither spreadsheets nor BI tools are designed to fully answer them.
Why decisions are harder than they look
In real business conditions, multiple factors move at the same time.
Prices change. Costs evolve. Customers react. Payments are delayed. Growth accelerates or slows down.
These dynamics do not happen in isolation. They interact.
A pricing decision affects demand. Demand affects revenue. Revenue affects cash. Cash affects the ability to invest or grow.
When these relationships are not clearly visible, decisions are often made based on simplified assumptions.
And this is why even well-reasoned decisions can lead to unexpected outcomes.
Beyond calculation and visualization
The challenge is not a lack of data. It is a lack of visibility into how that data behaves under different conditions.
What is missing is a layer that sits between analysis and decision-making. A layer that allows businesses to explore not just what is happening, but what could happen.
This is where a different approach becomes necessary.
The decision layer
Instead of focusing only on results, this approach focuses on relationships. Instead of working with a single projection, it explores multiple scenarios. Instead of looking at variables in isolation, it considers how they interact.
With this kind of approach, businesses can:
test how pricing changes affect demand and margins
understand how growth impacts liquidity over time
evaluate how multiple factors combine to influence outcomes
see how sensitive their results are to change
This turns financial analysis into something more dynamic — and more useful for decision-making.
A shift in perspective
The real shift is not about replacing tools. Spreadsheets and BI platforms will continue to play a central role.
But on their own, they are no longer enough. Аs decisions become more complex, the challenge is not just to calculate or visualize results. It is to understand how those results change when multiple factors move at the same time.
This is where a new layer becomes necessary.
From:
calculation and reporting
To:
understanding interactions and supporting real decisions
Because in increasingly complex environments, knowing the numbers is no longer enough. Understanding what drives them and how they might change, is what makes the difference.
Final thought
Most financial tools do exactly what they are designed to do.
Spreadsheets calculate. BI tools explain.
But decisions require something more. They require understanding how outcomes change when conditions change.
If this feels familiar
If you’ve ever had a situation where the data was clear, but the decision was not, you’ve likely experienced this gap.
With our What-If approach, you can move beyond static analysis and explore how real decisions would play out across multiple scenarios using your own financial data.
This allows you to see not just one expected result, but a range of possible outcomes, and to make decisions with greater clarity and confidence.
👉 Book a 30-minute strategy session to see how this works in practice
© 2026 FinTellect AI. All rights reserved.
Contacts
Fintellect AI
Knyaz Boris I 87, Sofia, Bulgaria
contact@fintellectai.com