
What Spreadsheets Don’t Show You
And why understanding what drives the numbers matters more than ever
CFO INSIGHTS
Zhivka Nedyalkova
4/23/20263 min read
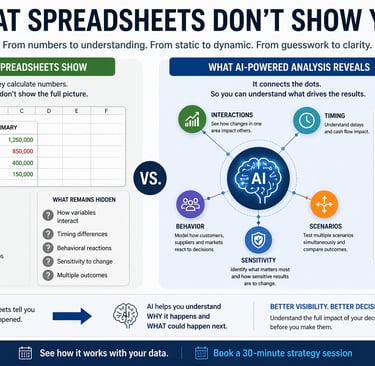
What Spreadsheets Don’t Show You
And why understanding what drives the numbers matters more than ever
Spreadsheets have been the foundation of financial work for decades.
They are reliable, flexible, and incredibly powerful when it comes to organizing and calculating data. Most businesses still depend on them for budgeting, forecasting, and reporting.
And for many tasks, they work perfectly well.
But there is one important limitation that becomes more visible as businesses grow and decisions become more complex.
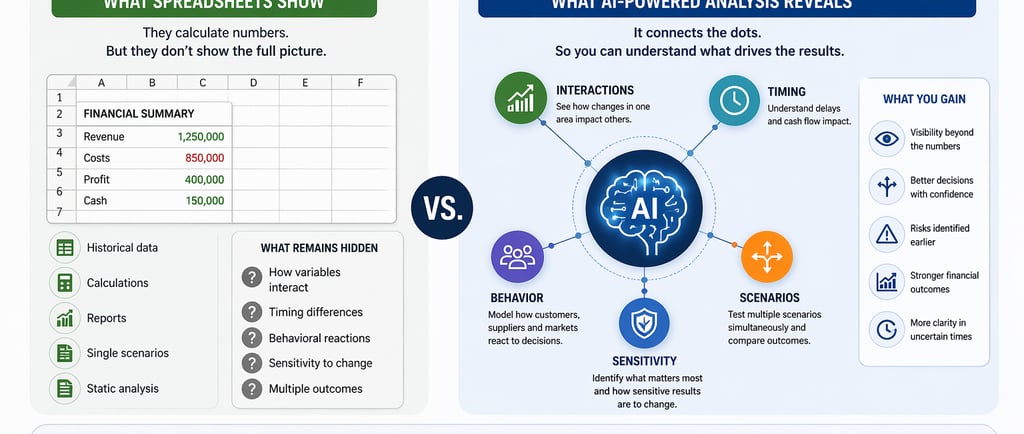
Spreadsheets are designed to calculate results. They are not designed to show what drives those results.
The difference between numbers and understanding
In a typical financial model, you can see revenue, costs, and profit. You can track changes over time and adjust assumptions.
But what is often missing is a clear view of how different factors interact with each other.
For example:
What happens if prices increase, but demand changes at the same time?
How does growth affect cash flow when payments are delayed?
What if costs increase while revenue grows more slowly than expected?
Each of these questions can be modeled in a spreadsheet. But they are usually tested one at a time. In reality, they rarely happen one at a time.
What remains hidden
As a result, several important dynamics often stay hidden:
Interaction between variables
Most financial outcomes are not driven by a single factor. They are shaped by how multiple variables move together.
Timing differences
Revenue, costs, and cash do not move at the same speed. A delay in one area can create pressure elsewhere.
Behavioral reactions
Customers, suppliers, and markets react to decisions. These reactions are difficult to capture in static models.
Sensitivity to change
Small changes can sometimes have a much larger impact than expected.
Spreadsheets contain the data. But they do not always make these relationships visible.
Why this matters in practice
This limitation becomes critical when decisions need to be made.
Consider a situation where a company decides to increase prices, invest in growth, or expand its team.
In each case, the initial analysis may look solid.
But the outcome depends on how several factors evolve together:
how customers respond
how costs change over time
when cash actually arrives
how different decisions interact
Without seeing these connections, decisions are often made based on simplified assumptions. And this is where unexpected results come from.
Where AI changes the picture
This is not a question of replacing spreadsheets. It is about extending what they can do.
AI introduces a different layer — one that focuses not just on calculation, but on relationships.
Instead of testing one scenario at a time, AI makes it possible to explore multiple scenarios simultaneously and understand how different variables interact.
It can:
connect changes in pricing, demand, and cost
show how timing differences affect cash flow
reveal how sensitive results are to small changes
simulate different outcomes based on real data
This turns static analysis into something much more dynamic.
From static models to decision visibility
The real shift is not technological. It is conceptual.
From:
seeing numbersTo:
understanding what drives them
This is especially important in environments where:
conditions change quickly
multiple factors move at the same time
decisions have long-term consequences
Because in these situations, knowing the result is not enough. You need to understand how that result can change.
Final thought
Spreadsheets are not going away. They will remain a core part of financial work.
But as decisions become more complex, the need for visibility beyond the numbers becomes more important.
The real question is no longer: “What do the numbers show?” But: “What is actually driving them?”
If this feels familiar
If you’ve ever had a situation where the numbers looked right- but the outcome was different- you’re not alone.
In most cases, the missing piece is not data. It is visibility into how different factors interact.
With our AI-powered What-If approach, you can go beyond static models and test how real decisions would play out across multiple scenarios — using your actual financial data.
This allows you to understand not just the expected outcome, but the range of possible ones.
👉 Book a 30-minute strategy session to see how this works in practice
© 2026 FinTellect AI. All rights reserved.
Contacts
Fintellect AI
Knyaz Boris I 87, Sofia, Bulgaria
contact@fintellectai.com